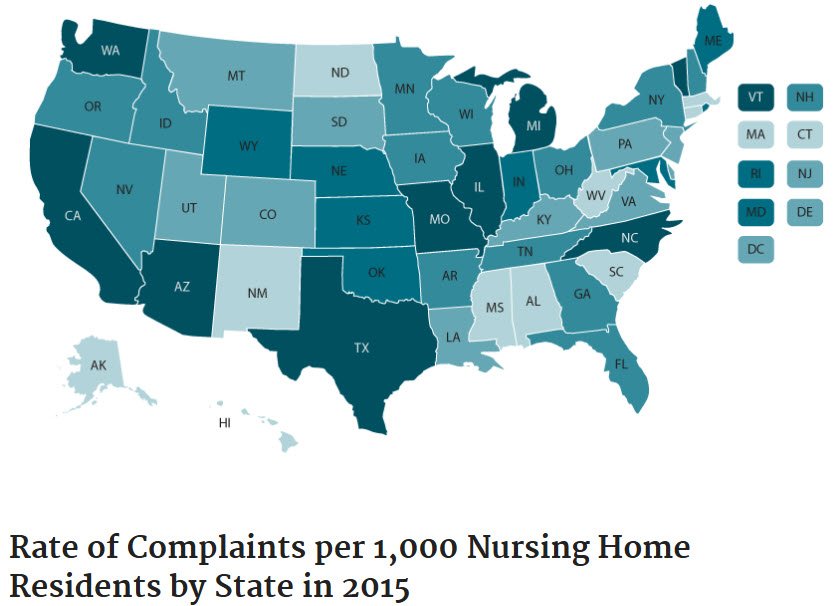
Trends in Nursing Home Complaints (2011-2015)
The nursing home complaint process is a critical safeguard to protect vulnerable residents of nursing homes. The Centers for Medicare & Medicaid Services relies on the States' respective survey agencies to respond to health and safety concerns raised by residents, their families, and nursing home staff. State agencies must investigate the most serious complaints onsite within certain timeframes. However, a July 2006 Office of the Inspector General report found that State agencies did not conduct onsite investigations within the required timeframes for some complaints. Our September 2017 data brief "A Few States Fell Short In Timely Investigation of The Most Serious Nursing Home Complaints: 2011-2015" examines the extent to which States met required timeframes for investigating the most serious nursing home complaints between 2011 and 2015. To complement this data brief, the map below displays details on nursing home complaint trends between 2011 and 2015 for each State, including the number of complaints received and the number of the most serious complaints that a State investigated late.
View an updated map with 2016 through 2018 nursing home complaint data.
Jump to
Alabama | Alaska | Arizona | Arkansas | California | Colorado | Connecticut | Delaware | District of Columbia | Florida | Georgia | Hawaii | Idaho | Illinois | Indiana | Iowa | Kansas | Kentucky | Louisiana | Maine | Maryland | Massachusetts | Michigan | Minnesota | Mississippi | Missouri | Montana | Nebraska | Nevada | New Hampshire | New Jersey | New Mexico | New York | North Carolina | North Dakota | Ohio | Oklahoma | Oregon | Pennsylvania | Rhode Island | South Carolina | South Dakota | Tennessee | Texas | Utah | Vermont | Virginia | Washington | West Virginia | Wisconsin | Wyoming | Definitions
Alabama
Trends in Nursing Home Complaints
|
2011 |
2012 |
2013 |
2014 |
2015 |
Number of Complaints Per 1,000 Nursing Home Residents |
9.3 |
11.2 |
10.4 |
12.5 |
6.2 |
| |
| Number of Immediate Jeopardy Complaints |
85 |
82 |
41 |
48 |
31 |
| Number of Immediate Jeopardy Complaints Not Investigated Within 2 Days |
2 |
5 |
1 |
0 |
0 |
| |
| Number of High Priority Complaints |
63 |
78 |
74 |
60 |
41 |
| Number of High Priority Complaints Not Investigated Within 10 Days** |
1 |
3 |
1 |
14 |
2 |
**State did not conduct an investigation for 1 high priority complaint between 2011 and 2015.
Alaska
Trends in Nursing Home Complaints
|
2011 |
2012 |
2013 |
2014 |
2015 |
Number of Complaints Per 1,000 Nursing Home Residents |
31.3 |
32.6 |
10 |
33.5 |
14.6 |
| |
| Number of Immediate Jeopardy Complaints |
0 |
0 |
1 |
1 |
0 |
| Number of Immediate Jeopardy Complaints Not Investigated Within 2 Days |
N/A |
N/A |
0 |
0 |
N/A |
| |
| Number of High Priority Complaints |
3 |
2 |
3 |
12 |
3 |
| Number of High Priority Complaints Not Investigated Within 10 Days |
0 |
1 |
0 |
0 |
0 |
Arizona
Trends in Nursing Home Complaints
|
2011 |
2012 |
2013 |
2014 |
2015 |
Number of Complaints Per 1,000 Nursing Home Residents |
47.5 |
64.6 |
57.4 |
112.3 |
89.5 |
| |
| Number of Immediate Jeopardy Complaints |
4 |
11 |
10 |
19 |
0 |
| Number of Immediate Jeopardy Complaints Not Investigated Within 2 Days |
0 |
1 |
0 |
0 |
N/A |
| |
| Number of High Priority Complaints |
391 |
643 |
632 |
950 |
812 |
| Number of High Priority Complaints Not Investigated Within 10 Days** |
344 |
578 |
586 |
852 |
682 |
**State did not conduct an investigation for 29 high priority complaints between 2011 and 2015.
Arkansas
Trends in Nursing Home Complaints
|
2011 |
2012 |
2013 |
2014 |
2015 |
Number of Complaints Per 1,000 Nursing Home Residents |
39.7 |
46 |
40.4 |
34.6 |
36.5 |
| |
| Number of Immediate Jeopardy Complaints |
53 |
39 |
23 |
68 |
76 |
| Number of Immediate Jeopardy Complaints Not Investigated Within 2 Days |
0 |
2 |
1 |
0 |
1 |
| |
| Number of High Priority Complaints |
472 |
573 |
482 |
413 |
421 |
| Number of High Priority Complaints Not Investigated Within 10 Days |
7 |
20 |
7 |
12 |
3 |
California
Trends in Nursing Home Complaints
|
2011 |
2012 |
2013 |
2014 |
2015 |
Number of Complaints Per 1,000 Nursing Home Residents |
2.1 |
40 |
45 |
52.4 |
60.5 |
| |
| Number of Immediate Jeopardy Complaints |
6 |
178 |
188 |
380 |
416 |
| Number of Immediate Jeopardy Complaints Not Investigated Within 2 Days* |
0 |
4 |
7 |
13 |
6 |
| |
| Number of High Priority Complaints |
141 |
2,721 |
3,231 |
3,773 |
4,739 |
| Number of High Priority Complaints Not Investigated Within 10 Days** |
5 |
50 |
67 |
116 |
104 |
*State did not conduct an investigation for 2 immediate jeopardy complaints between 2011 and 2015.
**State did not conduct an investigation for 26 high priority complaints between 2011 and 2015.
Colorado
Trends in Nursing Home Complaints
|
2011 |
2012 |
2013 |
2014 |
2015 |
Number of Complaints Per 1,000 Nursing Home Residents |
17 |
15.9 |
20.8 |
18.9 |
21.1 |
| |
| Number of Immediate Jeopardy Complaints |
13 |
12 |
27 |
19 |
11 |
| Number of Immediate Jeopardy Complaints Not Investigated Within 2 Days |
3 |
1 |
2 |
1 |
1 |
| |
| Number of High Priority Complaints |
173 |
145 |
182 |
184 |
206 |
| Number of High Priority Complaints Not Investigated Within 10 Days |
27 |
20 |
9 |
18 |
25 |
Connecticut
Trends in Nursing Home Complaints
|
2011 |
2012 |
2013 |
2014 |
2015 |
Number of Complaints Per 1,000 Nursing Home Residents |
12.9 |
15.3 |
13.4 |
14.7 |
18.9 |
| |
| Number of Immediate Jeopardy Complaints |
2 |
3 |
3 |
1 |
3 |
| Number of Immediate Jeopardy Complaints Not Investigated Within 2 Days |
0 |
0 |
0 |
0 |
1 |
| |
| Number of High Priority Complaints |
18 |
28 |
18 |
12 |
28 |
| Number of High Priority Complaints Not Investigated Within 10 Days |
3 |
2 |
0 |
2 |
4 |
Delaware
Trends in Nursing Home Complaints
|
2011 |
2012 |
2013 |
2014 |
2015 |
Number of Complaints Per 1,000 Nursing Home Residents |
55.8 |
54 |
41.2 |
34.3 |
18.2 |
| |
| Number of Immediate Jeopardy Complaints |
0 |
1 |
5 |
2 |
0 |
| Number of Immediate Jeopardy Complaints Not Investigated Within 2 Days* |
N/A |
0 |
1 |
0 |
N/A |
| |
| Number of High Priority Complaints |
44 |
45 |
102 |
121 |
69 |
| Number of High Priority Complaints Not Investigated Within 10 Days** |
34 |
40 |
83 |
76 |
44 |
*State did not conduct an investigation for 1 immediate jeopardy complaint between 2011 and 2015.
**State did not conduct an investigation for 27 high priority complaints between 2011 and 2015.
District of Columbia
Trends in Nursing Home Complaints
|
2011 |
2012 |
2013 |
2014 |
2015 |
Number of Complaints Per 1,000 Nursing Home Residents |
9.9 |
13.3 |
5.5 |
16.2 |
24.1 |
| |
| Number of Immediate Jeopardy Complaints |
1 |
0 |
0 |
0 |
0 |
| Number of Immediate Jeopardy Complaints Not Investigated Within 2 Days |
0 |
N/A |
N/A |
N/A |
N/A |
| |
| Number of High Priority Complaints |
3 |
6 |
0 |
4 |
2 |
| Number of High Priority Complaints Not Investigated Within 10 Days |
0 |
0 |
N/A |
0 |
0 |
Florida
Trends in Nursing Home Complaints
|
2011 |
2012 |
2013 |
2014 |
2015 |
Number of Complaints Per 1,000 Nursing Home Residents |
27.6 |
29.5 |
31.7 |
29.8 |
32 |
| |
| Number of Immediate Jeopardy Complaints |
90 |
112 |
151 |
96 |
52 |
| Number of Immediate Jeopardy Complaints Not Investigated Within 2 Days |
0 |
0 |
0 |
0 |
0 |
| |
| Number of High Priority Complaints |
938 |
1,003 |
1,088 |
773 |
643 |
| Number of High Priority Complaints Not Investigated Within 10 Days** |
12 |
15 |
11 |
17 |
10 |
**State did not conduct an investigation for 8 high priority complaints between 2011 and 2015.
Georgia
Trends in Nursing Home Complaints
|
2011 |
2012 |
2013 |
2014 |
2015 |
Number of Complaints Per 1,000 Nursing Home Residents |
26 |
25.1 |
25.9 |
29.1 |
31.8 |
| |
| Number of Immediate Jeopardy Complaints |
57 |
123 |
178 |
592 |
478 |
| Number of Immediate Jeopardy Complaints Not Investigated Within 2 Days* |
6 |
4 |
7 |
28 |
258 |
| |
| Number of High Priority Complaints |
722 |
613 |
637 |
311 |
379 |
| Number of High Priority Complaints Not Investigated Within 10 Days** |
31 |
21 |
36 |
53 |
185 |
*State did not conduct an investigation for 2 immediate jeopardy complaints between 2011 and 2015.
**State did not conduct an investigation for 5 high priority complaints between 2011 and 2015.
Hawaii
Trends in Nursing Home Complaints
|
2011 |
2012 |
2013 |
2014 |
2015 |
Number of Complaints Per 1,000 Nursing Home Residents |
4.1 |
3.2 |
3.2 |
4 |
2.1 |
| |
| Number of Immediate Jeopardy Complaints |
1 |
0 |
0 |
0 |
0 |
| Number of Immediate Jeopardy Complaints Not Investigated Within 2 Days |
0 |
N/A |
N/A |
N/A |
N/A |
| |
| Number of High Priority Complaints |
2 |
2 |
0 |
2 |
0 |
| Number of High Priority Complaints Not Investigated Within 10 Days** |
1 |
1 |
N/A |
2 |
N/A |
**State did not conduct an investigation for 1 high priority complaint between 2011 and 2015.
Idaho
Trends in Nursing Home Complaints
|
2011 |
2012 |
2013 |
2014 |
2015 |
Number of Complaints Per 1,000 Nursing Home Residents |
24.8 |
25.4 |
23.8 |
23.4 |
35.4 |
| |
| Number of Immediate Jeopardy Complaints |
4 |
4 |
1 |
3 |
5 |
| Number of Immediate Jeopardy Complaints Not Investigated Within 2 Days |
0 |
0 |
0 |
0 |
0 |
| |
| Number of High Priority Complaints |
25 |
30 |
19 |
22 |
16 |
| Number of High Priority Complaints Not Investigated Within 10 Days |
0 |
2 |
1 |
7 |
9 |
Illinois
Trends in Nursing Home Complaints
|
2011 |
2012 |
2013 |
2014 |
2015 |
Number of Complaints Per 1,000 Nursing Home Residents |
35.1 |
42.1 |
46.1 |
51.8 |
65.6 |
| |
| Number of Immediate Jeopardy Complaints |
34 |
128 |
316 |
367 |
309 |
| Number of Immediate Jeopardy Complaints Not Investigated Within 2 Days* |
3 |
1 |
15 |
6 |
1 |
| |
| Number of High Priority Complaints |
1,112 |
1,406 |
1,666 |
1,970 |
3,065 |
| Number of High Priority Complaints Not Investigated Within 10 Days** |
390 |
507 |
381 |
48 |
33 |
*State did not conduct an investigation for 3 immediate jeopardy complaints between 2011 and 2015.
**State did not conduct an investigation for 6 high priority complaints between 2011 and 2015.
Indiana
Trends in Nursing Home Complaints
|
2011 |
2012 |
2013 |
2014 |
2015 |
Number of Complaints Per 1,000 Nursing Home Residents |
36.1 |
39.6 |
42.8 |
41.4 |
46.2 |
| |
| Number of Immediate Jeopardy Complaints |
63 |
37 |
23 |
26 |
20 |
| Number of Immediate Jeopardy Complaints Not Investigated Within 2 Days |
0 |
0 |
0 |
0 |
0 |
| |
| Number of High Priority Complaints |
609 |
523 |
562 |
522 |
651 |
| Number of High Priority Complaints Not Investigated Within 10 Days |
14 |
8 |
1 |
2 |
6 |
Iowa
Trends in Nursing Home Complaints
|
2011 |
2012 |
2013 |
2014 |
2015 |
Number of Complaints Per 1,000 Nursing Home Residents |
25.7 |
25.9 |
25.7 |
27.9 |
31.3 |
| |
| Number of Immediate Jeopardy Complaints |
20 |
14 |
16 |
12 |
20 |
| Number of Immediate Jeopardy Complaints Not Investigated Within 2 Days |
0 |
0 |
0 |
0 |
0 |
| |
| Number of High Priority Complaints |
426 |
315 |
334 |
340 |
431 |
| Number of High Priority Complaints Not Investigated Within 10 Days |
13 |
19 |
22 |
46 |
49 |
Kansas
Trends in Nursing Home Complaints
|
2011 |
2012 |
2013 |
2014 |
2015 |
Number of Complaints Per 1,000 Nursing Home Residents |
42 |
46.8 |
40.1 |
50.4 |
53.3 |
| |
| Number of Immediate Jeopardy Complaints |
20 |
45 |
66 |
44 |
75 |
| Number of Immediate Jeopardy Complaints Not Investigated Within 2 Days |
1 |
0 |
1 |
1 |
1 |
| |
| Number of High Priority Complaints |
90 |
100 |
90 |
110 |
137 |
| Number of High Priority Complaints Not Investigated Within 10 Days** |
5 |
2 |
1 |
4 |
5 |
**State did not conduct an investigation for 1 high priority complaint between 2011 and 2015.
Kentucky
Trends in Nursing Home Complaints
|
2011 |
2012 |
2013 |
2014 |
2015 |
Number of Complaints Per 1,000 Nursing Home Residents |
28.5 |
26.8 |
24 |
27.1 |
28.7 |
| |
| Number of Immediate Jeopardy Complaints |
161 |
238 |
242 |
302 |
317 |
| Number of Immediate Jeopardy Complaints Not Investigated Within 2 Days |
4 |
9 |
9 |
11 |
5 |
| |
| Number of High Priority Complaints |
440 |
352 |
309 |
333 |
348 |
| Number of High Priority Complaints Not Investigated Within 10 Days |
296 |
30 |
9 |
9 |
10 |
Louisiana
Trends in Nursing Home Complaints
|
2011 |
2012 |
2013 |
2014 |
2015 |
Number of Complaints Per 1,000 Nursing Home Residents |
17.3 |
19 |
20.9 |
21.4 |
21.1 |
| |
| Number of Immediate Jeopardy Complaints |
105 |
115 |
114 |
121 |
151 |
| Number of Immediate Jeopardy Complaints Not Investigated Within 2 Days |
6 |
5 |
4 |
3 |
4 |
| |
| Number of High Priority Complaints |
288 |
307 |
265 |
207 |
205 |
| Number of High Priority Complaints Not Investigated Within 10 Days |
11 |
19 |
13 |
8 |
6 |
Maine
Trends in Nursing Home Complaints
|
2011 |
2012 |
2013 |
2014 |
2015 |
Number of Complaints Per 1,000 Nursing Home Residents |
49.2 |
43.2 |
58 |
52.6 |
51 |
| |
| Number of Immediate Jeopardy Complaints |
7 |
9 |
8 |
18 |
3 |
| Number of Immediate Jeopardy Complaints Not Investigated Within 2 Days |
0 |
2 |
0 |
0 |
0 |
| |
| Number of High Priority Complaints |
217 |
191 |
304 |
144 |
69 |
| Number of High Priority Complaints Not Investigated Within 10 Days |
102 |
88 |
210 |
79 |
0 |
Maryland
Trends in Nursing Home Complaints
|
2011 |
2012 |
2013 |
2014 |
2015 |
Number of Complaints Per 1,000 Nursing Home Residents |
41.8 |
42.5 |
42.4 |
48.6 |
45.5 |
| |
| Number of Immediate Jeopardy Complaints |
7 |
0 |
1 |
2 |
5 |
| Number of Immediate Jeopardy Complaints Not Investigated Within 2 Days |
0 |
N/A |
0 |
1 |
0 |
| |
| Number of High Priority Complaints |
944 |
812 |
822 |
1,013 |
876 |
| Number of High Priority Complaints Not Investigated Within 10 Days |
742 |
629 |
537 |
735 |
648 |
Massachusetts
Trends in Nursing Home Complaints
|
2011 |
2012 |
2013 |
2014 |
2015 |
Number of Complaints Per 1,000 Nursing Home Residents |
11.9 |
9.5 |
9.8 |
10.9 |
10.6 |
| |
| Number of Immediate Jeopardy Complaints |
0 |
0 |
2 |
1 |
4 |
| Number of Immediate Jeopardy Complaints Not Investigated Within 2 Days |
N/A |
N/A |
0 |
0 |
0 |
| |
| Number of High Priority Complaints |
478 |
359 |
362 |
412 |
285 |
| Number of High Priority Complaints Not Investigated Within 10 Days** |
183 |
250 |
272 |
239 |
232 |
**State did not conduct an investigation for 2 high priority complaints between 2011 and 2015.
Michigan
Trends in Nursing Home Complaints
|
2011 |
2012 |
2013 |
2014 |
2015 |
Number of Complaints Per 1,000 Nursing Home Residents |
31.5 |
37.1 |
48.4 |
58.4 |
73.7 |
| |
| Number of Immediate Jeopardy Complaints |
89 |
112 |
114 |
118 |
110 |
| Number of Immediate Jeopardy Complaints Not Investigated Within 2 Days |
3 |
3 |
2 |
3 |
2 |
| |
| Number of High Priority Complaints |
1,182 |
1,342 |
1,650 |
1,842 |
2,241 |
| Number of High Priority Complaints Not Investigated Within 10 Days** |
320 |
582 |
748 |
40 |
70 |
**State did not conduct an investigation for 2 high priority complaints between 2011 and 2015.
Minnesota
Trends in Nursing Home Complaints
|
2011 |
2012 |
2013 |
2014 |
2015 |
Number of Complaints Per 1,000 Nursing Home Residents |
12.7 |
9 |
11.5 |
14.5 |
33.9 |
| |
| Number of Immediate Jeopardy Complaints |
67 |
56 |
29 |
43 |
65 |
| Number of Immediate Jeopardy Complaints Not Investigated Within 2 Days |
6 |
3 |
0 |
4 |
4 |
| |
| Number of High Priority Complaints |
210 |
111 |
182 |
155 |
208 |
| Number of High Priority Complaints Not Investigated Within 10 Days |
18 |
5 |
7 |
9 |
10 |
Mississippi
Trends in Nursing Home Complaints
|
2011 |
2012 |
2013 |
2014 |
2015 |
Number of Complaints Per 1,000 Nursing Home Residents |
16.6 |
19.5 |
16.3 |
16.7 |
13.2 |
| |
| Number of Immediate Jeopardy Complaints |
17 |
29 |
54 |
79 |
47 |
| Number of Immediate Jeopardy Complaints Not Investigated Within 2 Days |
2 |
10 |
3 |
11 |
5 |
| |
| Number of High Priority Complaints |
182 |
206 |
163 |
182 |
157 |
| Number of High Priority Complaints Not Investigated Within 10 Days** |
62 |
108 |
47 |
26 |
22 |
**State did not conduct an investigation for 5 high priority complaints between 2011 and 2015.
Missouri
Trends in Nursing Home Complaints
|
2011 |
2012 |
2013 |
2014 |
2015 |
Number of Complaints Per 1,000 Nursing Home Residents |
69.9 |
72.9 |
78.5 |
94.7 |
105 |
| |
| Number of Immediate Jeopardy Complaints |
232 |
181 |
243 |
345 |
350 |
| Number of Immediate Jeopardy Complaints Not Investigated Within 2 Days |
0 |
0 |
0 |
0 |
0 |
| |
| Number of High Priority Complaints |
1,334 |
1,387 |
1,549 |
1,920 |
2,108 |
| Number of High Priority Complaints Not Investigated Within 10 Days** |
64 |
64 |
53 |
57 |
76 |
**State did not conduct an investigation for 1 high priority complaint between 2011 and 2015.
Montana
Trends in Nursing Home Complaints
|
2011 |
2012 |
2013 |
2014 |
2015 |
Number of Complaints Per 1,000 Nursing Home Residents |
14.3 |
13 |
18 |
14.6 |
18.8 |
| |
| Number of Immediate Jeopardy Complaints |
2 |
0 |
3 |
0 |
1 |
| Number of Immediate Jeopardy Complaints Not Investigated Within 2 Days |
0 |
N/A |
0 |
N/A |
0 |
| |
| Number of High Priority Complaints |
9 |
9 |
20 |
9 |
8 |
| Number of High Priority Complaints Not Investigated Within 10 Days |
1 |
0 |
1 |
0 |
1 |
Nebraska
Trends in Nursing Home Complaints
|
2011 |
2012 |
2013 |
2014 |
2015 |
| Number of Complaints Per 1,000 Nursing Home Residents |
30.9 |
37.6 |
45.3 |
47 |
54.9 |
| |
| Number of Immediate Jeopardy Complaints |
6 |
20 |
24 |
15 |
19 |
| Number of Immediate Jeopardy Complaints Not Investigated Within 2 Days |
0 |
3 |
1 |
1 |
0 |
| |
| Number of High Priority Complaints |
61 |
70 |
89 |
91 |
98 |
| Number of High Priority Complaints Not Investigated Within 10 Days |
2 |
3 |
1 |
2 |
3 |
Nevada
Trends in Nursing Home Complaints
|
2011 |
2012 |
2013 |
2014 |
2015 |
Number of Complaints Per 1,000 Nursing Home Residents |
38.2 |
51.9 |
33.4 |
36.8 |
40.2 |
| |
| Number of Immediate Jeopardy Complaints |
3 |
1 |
2 |
2 |
1 |
| Number of Immediate Jeopardy Complaints Not Investigated Within 2 Days |
0 |
0 |
0 |
0 |
0 |
| |
| Number of High Priority Complaints |
42 |
22 |
27 |
19 |
24 |
| Number of High Priority Complaints Not Investigated Within 10 Days |
13 |
4 |
10 |
3 |
5 |
New Hampshire
Trends in Nursing Home Complaints
|
2011 |
2012 |
2013 |
2014 |
2015 |
Number of Complaints Per 1,000 Nursing Home Residents |
6.3 |
31.7 |
26.1 |
28.2 |
30.7 |
| |
| Number of Immediate Jeopardy Complaints |
0 |
0 |
0 |
0 |
0 |
| Number of Immediate Jeopardy Complaints Not Investigated Within 2 Days |
N/A |
N/A |
N/A |
N/A |
N/A |
| |
| Number of High Priority Complaints |
4 |
1 |
2 |
1 |
1 |
| Number of High Priority Complaints Not Investigated Within 10 Days |
0 |
0 |
0 |
0 |
0 |
New Jersey
Trends in Nursing Home Complaints
|
2011 |
2012 |
2013 |
2014 |
2015 |
Number of Complaints Per 1,000 Nursing Home Residents |
41.1 |
41.5 |
38.1 |
34.6 |
21.3 |
| |
| Number of Immediate Jeopardy Complaints |
12 |
33 |
30 |
56 |
186 |
| Number of Immediate Jeopardy Complaints Not Investigated Within 2 Days |
0 |
0 |
0 |
7 |
50 |
| |
| Number of High Priority Complaints |
42 |
95 |
105 |
226 |
189 |
| Number of High Priority Complaints Not Investigated Within 10 Days** |
0 |
1 |
1 |
177 |
138 |
**State did not conduct an investigation for 22 high priority complaints between 2011 and 2015.
New Mexico
Trends in Nursing Home Complaints
|
2011 |
2012 |
2013 |
2014 |
2015 |
Number of Complaints Per 1,000 Nursing Home Residents |
23 |
28.1 |
19.1 |
8.8 |
12.9 |
| |
| Number of Immediate Jeopardy Complaints |
3 |
4 |
4 |
6 |
6 |
| Number of Immediate Jeopardy Complaints Not Investigated Within 2 Days |
0 |
0 |
0 |
0 |
0 |
| |
| Number of High Priority Complaints |
26 |
24 |
30 |
18 |
15 |
| Number of High Priority Complaints Not Investigated Within 10 Days |
1 |
5 |
0 |
0 |
0 |
New York
Trends in Nursing Home Complaints
|
2011 |
2012 |
2013 |
2014 |
2015 |
Number of Complaints Per 1,000 Nursing Home Residents |
40 |
40.1 |
42.2 |
42 |
40 |
| |
| Number of Immediate Jeopardy Complaints |
90 |
150 |
83 |
88 |
106 |
| Number of Immediate Jeopardy Complaints Not Investigated Within 2 Days |
0 |
0 |
2 |
2 |
2 |
| |
| Number of High Priority Complaints |
1,518 |
1,708 |
1,528 |
1,693 |
1,859 |
| Number of High Priority Complaints Not Investigated Within 10 Days** |
448 |
365 |
239 |
626 |
976 |
**State did not conduct an investigation for 7 high priority complaints between 2011 and 2015.
North Carolina
Trends in Nursing Home Complaints
|
2011 |
2012 |
2013 |
2014 |
2015 |
Number of Complaints Per 1,000 Nursing Home Residents |
51.5 |
48.2 |
50.3 |
56.5 |
63.1 |
| |
| Number of Immediate Jeopardy Complaints |
185 |
153 |
194 |
198 |
180 |
| Number of Immediate Jeopardy Complaints Not Investigated Within 2 Days |
7 |
1 |
3 |
9 |
6 |
| |
| Number of High Priority Complaints |
579 |
697 |
681 |
763 |
803 |
| Number of High Priority Complaints Not Investigated Within 10 Days** |
17 |
17 |
87 |
237 |
108 |
**State did not conduct an investigation for 3 high priority complaints between 2011 and 2015.
North Dakota
Trends in Nursing Home Complaints
|
2011 |
2012 |
2013 |
2014 |
2015 |
Number of Complaints Per 1,000 Nursing Home Residents |
5.1 |
5.6 |
5.6 |
8.9 |
6.6 |
| |
| Number of Immediate Jeopardy Complaints |
0 |
0 |
0 |
1 |
1 |
| Number of Immediate Jeopardy Complaints Not Investigated Within 2 Days |
N/A |
N/A |
N/A |
0 |
0 |
| |
| Number of High Priority Complaints |
1 |
0 |
0 |
0 |
0 |
| Number of High Priority Complaints Not Investigated Within 10 Days |
0 |
N/A |
N/A |
N/A |
N/A |
Ohio
Trends in Nursing Home Complaints
|
2011 |
2012 |
2013 |
2014 |
2015 |
Number of Complaints Per 1,000 Nursing Home Residents |
38.7 |
38.8 |
33.8 |
34.1 |
36.5 |
| |
| Number of Immediate Jeopardy Complaints |
223 |
361 |
344 |
376 |
439 |
| Number of Immediate Jeopardy Complaints Not Investigated Within 2 Days |
1 |
2 |
0 |
0 |
1 |
| |
| Number of High Priority Complaints |
1,621 |
1,615 |
1,637 |
1,786 |
2,047 |
| Number of High Priority Complaints Not Investigated Within 10 Days** |
16 |
12 |
26 |
11 |
2 |
**State did not conduct an investigation for 1 high priority complaint between 2011 and 2015.
Oklahoma
Trends in Nursing Home Complaints
|
2011 |
2012 |
2013 |
2014 |
2015 |
Number of Complaints Per 1,000 Nursing Home Residents |
53.3 |
58.2 |
56.1 |
62.7 |
54.4 |
| |
| Number of Immediate Jeopardy Complaints |
132 |
123 |
214 |
159 |
73 |
| Number of Immediate Jeopardy Complaints Not Investigated Within 2 Days |
1 |
1 |
5 |
2 |
1 |
| |
| Number of High Priority Complaints |
383 |
381 |
326 |
362 |
299 |
| Number of High Priority Complaints Not Investigated Within 10 Days** |
274 |
205 |
54 |
18 |
2 |
**State did not conduct an investigation for 1 high priority complaint between 2011 and 2015.
Oregon
Trends in Nursing Home Complaints
|
2011 |
2012 |
2013 |
2014 |
2015 |
Number of Complaints Per 1,000 Nursing Home Residents |
32.2 |
31.4 |
39.8 |
39.7 |
38.7 |
| |
| Number of Immediate Jeopardy Complaints |
0 |
0 |
0 |
0 |
0 |
| Number of Immediate Jeopardy Complaints Not Investigated Within 2 Days |
N/A |
N/A |
N/A |
N/A |
N/A |
| |
| Number of High Priority Complaints |
232 |
203 |
281 |
274 |
276 |
| Number of High Priority Complaints Not Investigated Within 10 Days |
105 |
99 |
180 |
230 |
233 |
Pennsylvania
Trends in Nursing Home Complaints
|
2011 |
2012 |
2013 |
2014 |
2015 |
Number of Complaints Per 1,000 Nursing Home Residents |
24 |
17.2 |
18.1 |
20.7 |
28.7 |
| |
| Number of Immediate Jeopardy Complaints |
9 |
9 |
2 |
0 |
1 |
| Number of Immediate Jeopardy Complaints Not Investigated Within 2 Days |
0 |
0 |
0 |
N/A |
0 |
| |
| Number of High Priority Complaints |
1,853 |
1,365 |
1,415 |
1,497 |
1,416 |
| Number of High Priority Complaints Not Investigated Within 10 Days** |
2 |
6 |
2 |
6 |
2 |
**State did not conduct an investigation for 14 high priority complaints between 2011 and 2015.
Rhode Island
Trends in Nursing Home Complaints
|
2011 |
2012 |
2013 |
2014 |
2015 |
Number of Complaints Per 1,000 Nursing Home Residents |
38.4 |
56.2 |
43.1 |
43.6 |
54.1 |
| |
| Number of Immediate Jeopardy Complaints |
0 |
0 |
0 |
0 |
0 |
| Number of Immediate Jeopardy Complaints Not Investigated Within 2 Days |
N/A |
N/A |
N/A |
N/A |
N/A |
| |
| Number of High Priority Complaints |
11 |
6 |
5 |
40 |
47 |
| Number of High Priority Complaints Not Investigated Within 10 Days |
0 |
0 |
0 |
8 |
27 |
South Carolina
Trends in Nursing Home Complaints
|
2011 |
2012 |
2013 |
2014 |
2015 |
Number of Complaints Per 1,000 Nursing Home Residents |
6.5 |
6.4 |
9.7 |
12.1 |
12.2 |
| |
| Number of Immediate Jeopardy Complaints |
9 |
6 |
17 |
6 |
8 |
| Number of Immediate Jeopardy Complaints Not Investigated Within 2 Days |
0 |
1 |
1 |
0 |
0 |
| |
| Number of High Priority Complaints |
99 |
101 |
145 |
194 |
193 |
| Number of High Priority Complaints Not Investigated Within 10 Days |
59 |
46 |
81 |
149 |
147 |
South Dakota
Trends in Nursing Home Complaints
|
2011 |
2012 |
2013 |
2014 |
2015 |
Number of Complaints Per 1,000 Nursing Home Residents |
1.6 |
1.3 |
0.9 |
11.8 |
16 |
| |
| Number of Immediate Jeopardy Complaints |
0 |
0 |
0 |
2 |
1 |
| Number of Immediate Jeopardy Complaints Not Investigated Within 2 Days |
N/A |
N/A |
N/A |
0 |
1 |
| |
| Number of High Priority Complaints |
3 |
0 |
3 |
11 |
13 |
| Number of High Priority Complaints Not Investigated Within 10 Days |
0 |
N/A |
0 |
0 |
0 |
Tennessee
Trends in Nursing Home Complaints
|
2011 |
2012 |
2013 |
2014 |
2015 |
Number of Complaints Per 1,000 Nursing Home Residents |
21.8 |
23.3 |
23.5 |
24.6 |
31.1 |
| |
| Number of Immediate Jeopardy Complaints |
171 |
184 |
264 |
292 |
434 |
| Number of Immediate Jeopardy Complaints Not Investigated Within 2 Days* |
136 |
84 |
214 |
268 |
396 |
| |
| Number of High Priority Complaints |
445 |
501 |
417 |
417 |
440 |
| Number of High Priority Complaints Not Investigated Within 10 Days** |
362 |
351 |
334 |
370 |
374 |
*State did not conduct an investigation for 1 immediate jeopardy complaint between 2011 and 2015.
**State did not conduct an investigation for 2 high priority complaints between 2011 and 2015.
Texas
Trends in Nursing Home Complaints
|
2011 |
2012 |
2013 |
2014 |
2015 |
Number of Complaints Per 1,000 Nursing Home Residents |
67.9 |
76.1 |
76.7 |
83.9 |
90 |
| |
| Number of Immediate Jeopardy Complaints |
712 |
599 |
673 |
970 |
1,243 |
| Number of Immediate Jeopardy Complaints Not Investigated Within 2 Days |
6 |
7 |
9 |
15 |
18 |
| |
| Number of High Priority Complaints |
3,889 |
3,862 |
3,731 |
4,206 |
4,366 |
| Number of High Priority Complaints Not Investigated Within 10 Days** |
25 |
117 |
154 |
106 |
400 |
**State did not conduct an investigation for 2 high priority complaints between 2011 and 2015.
Utah
Trends in Nursing Home Complaints
|
2011 |
2012 |
2013 |
2014 |
2015 |
Number of Complaints Per 1,000 Nursing Home Residents |
21.1 |
26.3 |
23 |
25.1 |
25.9 |
| |
| Number of Immediate Jeopardy Complaints |
6 |
13 |
6 |
7 |
7 |
| Number of Immediate Jeopardy Complaints Not Investigated Within 2 Days |
0 |
1 |
1 |
0 |
0 |
| |
| Number of High Priority Complaints |
19 |
18 |
19 |
28 |
27 |
| Number of High Priority Complaints Not Investigated Within 10 Days |
3 |
1 |
3 |
0 |
1 |
Vermont
Trends in Nursing Home Complaints
|
2011 |
2012 |
2013 |
2014 |
2015 |
Number of Complaints Per 1,000 Nursing Home Residents |
48.5 |
53.4 |
61.7 |
52 |
63.9 |
| |
| Number of Immediate Jeopardy Complaints |
8 |
14 |
6 |
6 |
5 |
| Number of Immediate Jeopardy Complaints Not Investigated Within 2 Days |
0 |
0 |
0 |
0 |
0 |
| |
| Number of High Priority Complaints |
29 |
34 |
28 |
42 |
33 |
| Number of High Priority Complaints Not Investigated Within 10 Days |
6 |
3 |
3 |
0 |
0 |
Virginia
Trends in Nursing Home Complaints
|
2011 |
2012 |
2013 |
2014 |
2015 |
Number of Complaints Per 1,000 Nursing Home Residents |
18.3 |
19.8 |
17.8 |
16.8 |
18.4 |
| |
| Number of Immediate Jeopardy Complaints |
1 |
0 |
1 |
1 |
2 |
| Number of Immediate Jeopardy Complaints Not Investigated Within 2 Days |
1 |
N/A |
1 |
0 |
0 |
| |
| Number of High Priority Complaints |
80 |
72 |
36 |
71 |
85 |
| Number of High Priority Complaints Not Investigated Within 10 Days |
16 |
7 |
4 |
10 |
19 |
Washington
Trends in Nursing Home Complaints
|
2011 |
2012 |
2013 |
2014 |
2015 |
Number of Complaints Per 1,000 Nursing Home Residents |
118.5 |
112.4 |
98.3 |
105.4 |
109 |
| |
| Number of Immediate Jeopardy Complaints |
81 |
94 |
132 |
67 |
41 |
| Number of Immediate Jeopardy Complaints Not Investigated Within 2 Days |
0 |
0 |
0 |
0 |
0 |
| |
| Number of High Priority Complaints |
1,457 |
1,314 |
1,048 |
919 |
1,048 |
| Number of High Priority Complaints Not Investigated Within 10 Days |
3 |
8 |
17 |
10 |
62 |
West Virginia
Trends in Nursing Home Complaints
|
2011 |
2012 |
2013 |
2014 |
2015 |
Number of Complaints Per 1,000 Nursing Home Residents |
30.2 |
24 |
26.9 |
21.5 |
11.7 |
| |
| Number of Immediate Jeopardy Complaints |
3 |
2 |
6 |
3 |
2 |
| Number of Immediate Jeopardy Complaints Not Investigated Within 2 Days |
1 |
0 |
0 |
0 |
0 |
| |
| Number of High Priority Complaints |
133 |
61 |
109 |
77 |
33 |
| Number of High Priority Complaints Not Investigated Within 10 Days |
30 |
18 |
4 |
4 |
1 |
Wisconsin
Trends in Nursing Home Complaints
|
2011 |
2012 |
2013 |
2014 |
2015 |
Number of Complaints Per 1,000 Nursing Home Residents |
28.9 |
33.6 |
34.9 |
35.6 |
39.8 |
| |
| Number of Immediate Jeopardy Complaints |
46 |
30 |
39 |
42 |
29 |
| Number of Immediate Jeopardy Complaints Not Investigated Within 2 Days |
1 |
1 |
0 |
1 |
0 |
| |
| Number of High Priority Complaints |
168 |
245 |
255 |
251 |
265 |
| Number of High Priority Complaints Not Investigated Within 10 Days |
7 |
14 |
19 |
7 |
7 |
Wyoming
Trends in Nursing Home Complaints
|
2011 |
2012 |
2013 |
2014 |
2015 |
Number of Complaints Per 1,000 Nursing Home Residents |
30.9 |
30.5 |
39.3 |
54.1 |
50.3 |
| |
| Number of Immediate Jeopardy Complaints |
4 |
4 |
5 |
5 |
8 |
| Number of Immediate Jeopardy Complaints Not Investigated Within 2 Days |
0 |
0 |
0 |
0 |
0 |
| |
| Number of High Priority Complaints |
10 |
11 |
18 |
28 |
23 |
| Number of High Priority Complaints Not Investigated Within 10 Days |
0 |
0 |
0 |
1 |
0 |
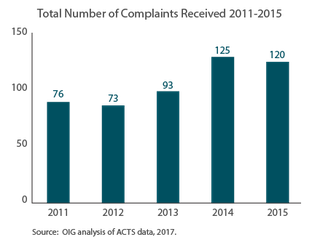
Source: OIG analysis of ACTS data, 2017.
Definitions
Immediate jeopardy complaints allege a situation in which the provider's noncompliance with Federal requirements has caused, or is likely to cause, serious injury, harm, impairment, or death to a resident.
High priority complaints allege a situation in which the provider's noncompliance with Federal requirements may have caused harm that negatively affects the resident's mental, physical, and/or psychosocial status.