Trends in Nursing Home Complaints (2016-2018)
The nursing home complaint process is a critical safeguard to protect vulnerable nursing home residents. The Centers for Medicare & Medicaid Services (CMS) relies upon each State's survey agency to respond to health and safety concerns raised by residents, their families, and nursing home staff. State agencies must investigate the most serious complaints on-site within certain timeframes. However, a previous Office of Inspector General (OIG) report found that a few States fell short in the timely investigation of the most serious nursing home complaints between 2011 and 2015. To complement this report, OIG published an interactive map that displays details on nursing home complaint trends between 2011 and 2015.
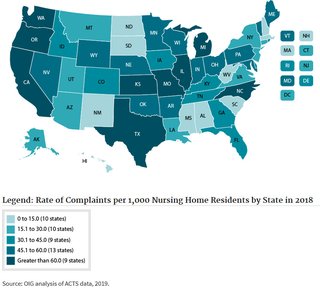
The map below updates this information for years 2016 through 2018. Specifically, it displays details on nursing home complaint trends between 2016 and 2018 for each State, including the number of complaints received and the number of the most serious complaints that a State investigated late. Click here to jump to national trends.
This map accompanies OIG's 2020 report, "States Continued to Fall Short in Meeting Required Timeframes for Investigating Nursing Home Complaints: 2016-2018." This report examines whether States that fell short in timely investigation of the most serious nursing home complaints in 2015 have since improved and provides additional insights on States' nursing home complaint and investigation trends between 2016 and 2018.
In addition, an ongoing OIG evaluation is examining CMS's oversight of State survey agencies' performance.
Rate of Complaints per 1,000 Nursing Home Residents
by State in 2018
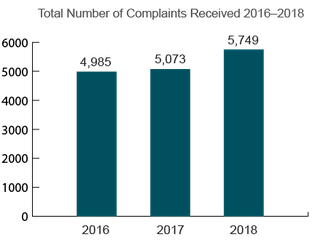
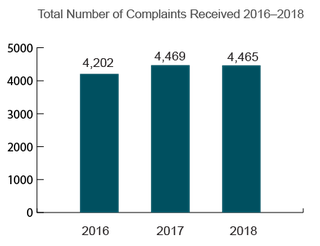
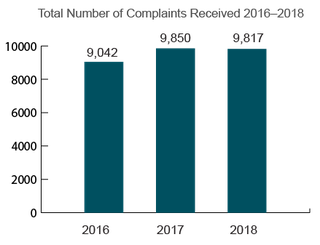
All States
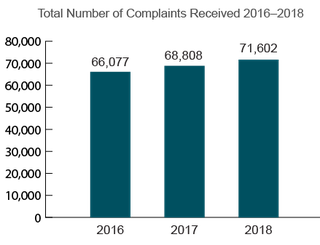
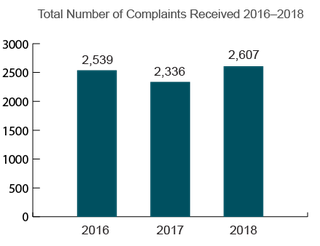
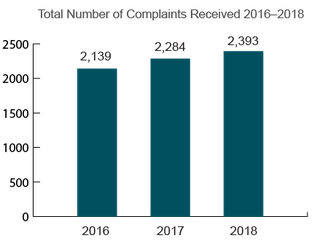
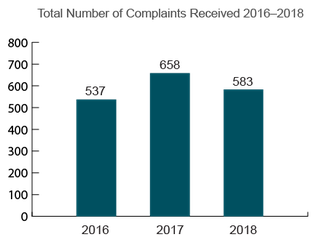
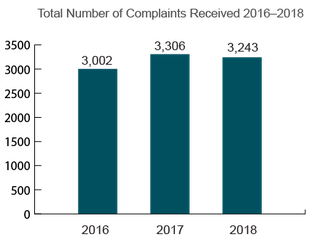
Trends in Nursing Home Complaints
|
2016 |
2017 |
2018 |
Number of Complaints Per 1,000 Nursing Home Residents |
47.3 |
49.9 |
52.3 |
| |
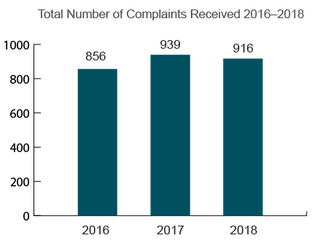
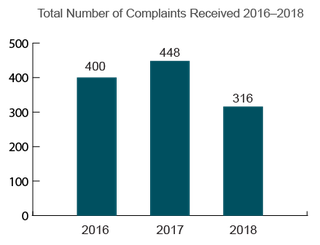
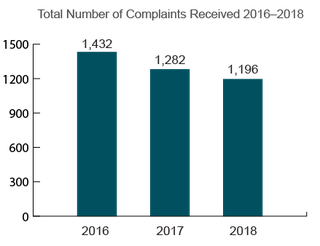
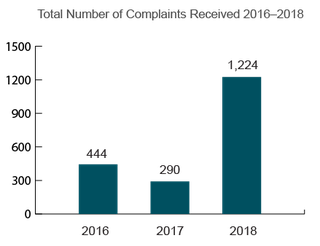
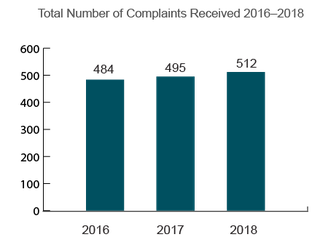
| Number of Immediate Jeopardy Complaints |
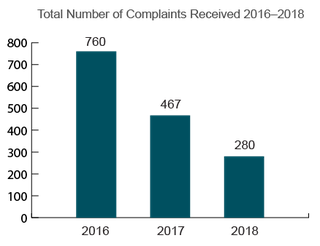
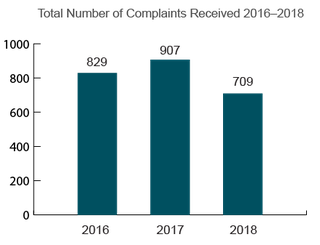
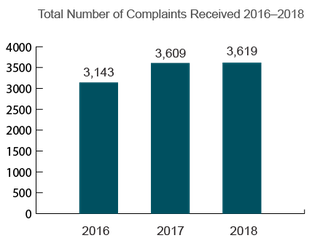
6,039 |
5,451 |
5,245 |
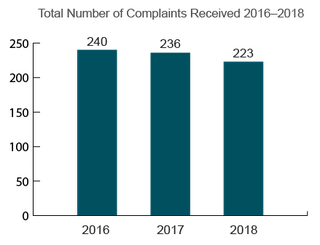
| Number of Immediate Jeopardy Complaints Not Investigated Within 2 Days* |
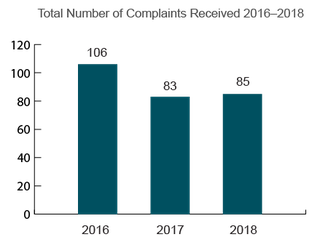
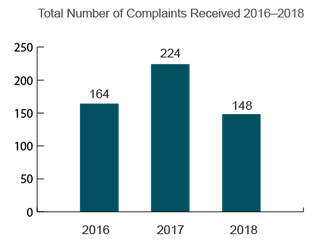
1,452 |
964 |
670 |
| |
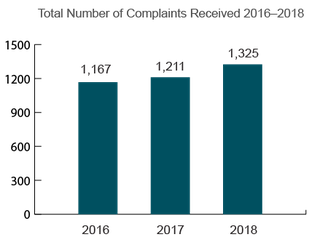
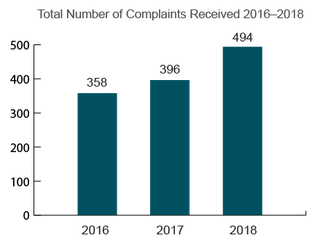
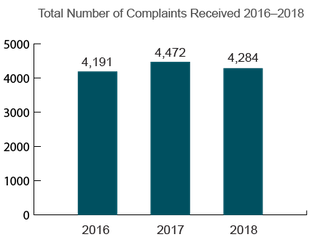
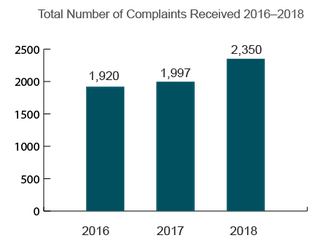
| Number of High Priority Complaints |
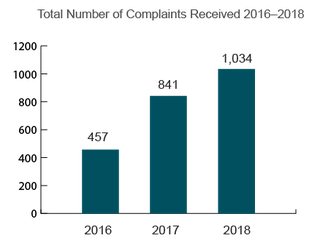
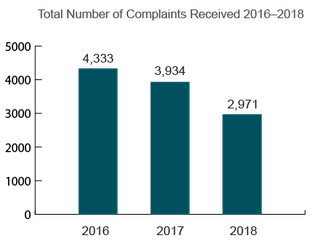
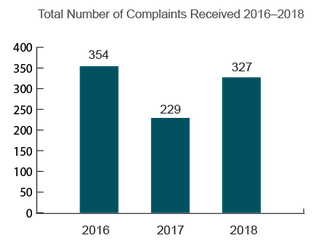
32,774 |
32,722 |
33,974 |
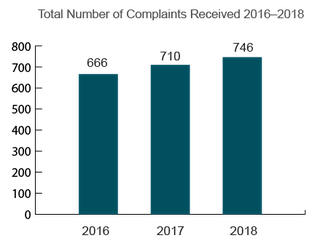
| Number of High Priority Complaints Not Investigated Within 10 Days |
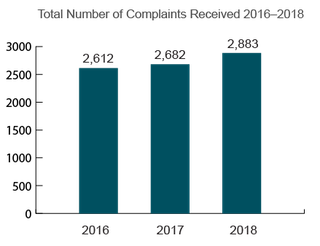
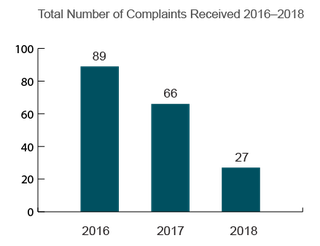
5,061 |
5,305 |
6,540 |
*9 immediate jeopardy complaints were not conducted between 2016 and 2018.
**224 high priority complaints were not conducted between 2016 and 2018.
Jump to
Alabama | Alaska | Arizona | Arkansas | California | Colorado | Connecticut | Delaware | District of Columbia | Florida | Georgia | Hawaii | Idaho | Illinois | Indiana | Iowa | Kansas | Kentucky | Louisiana | Maine | Maryland | Massachusetts | Michigan | Minnesota | Mississippi | Missouri | Montana | Nebraska | Nevada | New Hampshire | New Jersey | New Mexico | New York | North Carolina | North Dakota | Ohio | Oklahoma | Oregon | Pennsylvania | Rhode Island | South Carolina | South Dakota | Tennessee | Texas | Utah | Vermont | Virginia | Washington | West Virginia | Wisconsin | Wyoming | Definitions
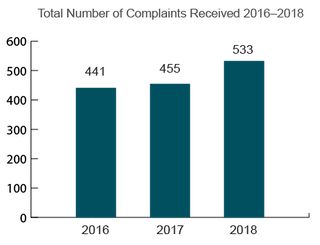
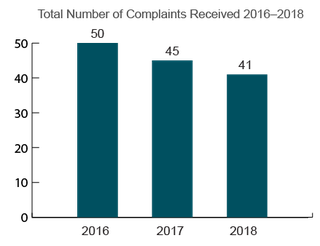
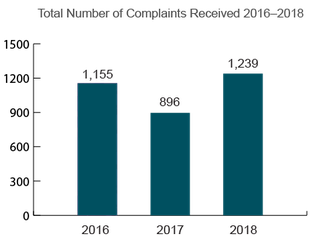
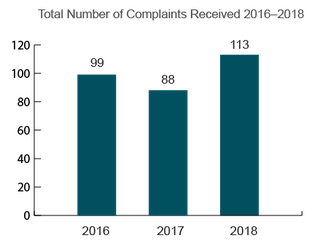
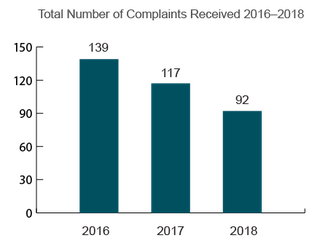
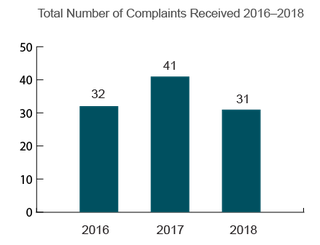
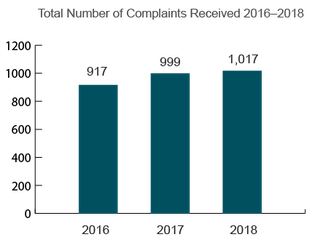
Alabama
Trends in Nursing Home Complaints
|
2016 |
2017 |
2018 |
Number of Complaints Per 1,000 Nursing Home Residents |
8.6 |
4.1 |
5.4 |
| |
| Number of Immediate Jeopardy Complaints |
61 |
36 |
18 |
| Number of Immediate Jeopardy Complaints Not Investigated Within 2 Days |
3 |
1 |
3 |
| |
| Number of High Priority Complaints |
51 |
22 |
39 |
| Number of High Priority Complaints Not Investigated Within 10 Days |
1 |
2 |
0 |
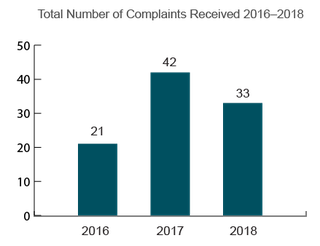
Alaska
Trends in Nursing Home Complaints
|
2016 |
2017 |
2018 |
Number of Complaints Per 1,000 Nursing Home Residents |
12.9 |
30 |
20.5 |
| |
| Number of Immediate Jeopardy Complaints |
0 |
0 |
0 |
| Number of Immediate Jeopardy Complaints Not Investigated Within 2 Days |
NA |
NA |
NA |
| |
| Number of High Priority Complaints |
1 |
3 |
2 |
| Number of High Priority Complaints Not Investigated Within 10 Days |
0 |
0 |
0 |
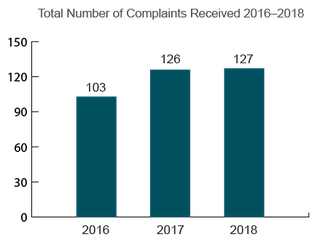
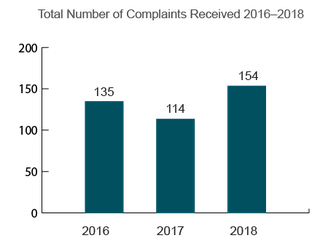
Arizona
Trends in Nursing Home Complaints
|
2016 |
2017 |
2018 |
Number of Complaints Per 1,000 Nursing Home Residents |
61 |
36.7 |
22.3 |
| |
| Number of Immediate Jeopardy Complaints |
5 |
5 |
1 |
| Number of Immediate Jeopardy Complaints Not Investigated Within 2 Days |
1 |
1 |
0 |
| |
| Number of High Priority Complaints |
516 |
312 |
202 |
| Number of High Priority Complaints Not Investigated Within 10 Days** |
413 |
268 |
179 |
**State did not conduct an investigation for 78 high priority complaints between 2016 and 2018.
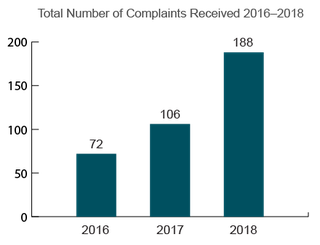
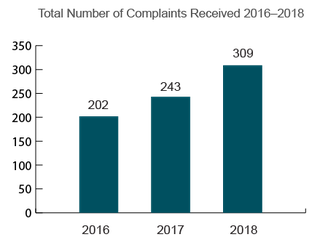
Arkansas
Trends in Nursing Home Complaints
|
2016 |
2017 |
2018 |
Number of Complaints Per 1,000 Nursing Home Residents |
25.2 |
47.2 |
58.7 |
| |
| Number of Immediate Jeopardy Complaints |
28 |
46 |
93 |
| Number of Immediate Jeopardy Complaints Not Investigated Within 2 Days* |
0 |
4 |
2 |
| |
| Number of High Priority Complaints |
336 |
587 |
764 |
| Number of High Priority Complaints Not Investigated Within 10 Days** |
10 |
25 |
11 |
*State did not conduct an investigation for 2 immediate jeopardy complaints between 2016 and 2018.
**State did not conduct an investigation for 2 high priority complaints between 2016 and 2018.
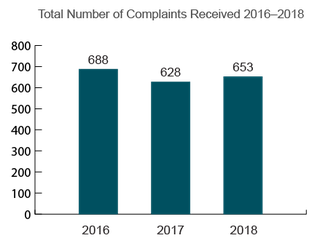
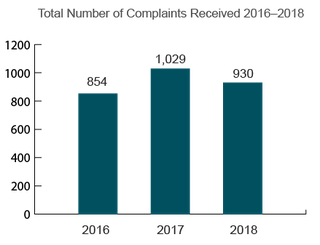
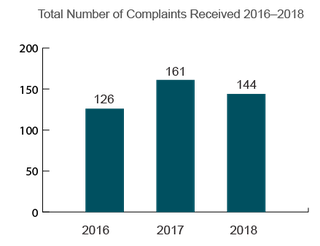
California
Trends in Nursing Home Complaints
|
2016 |
2017 |
2018 |
Number of Complaints Per 1,000 Nursing Home Residents |
67.3 |
73.6 |
80.9 |
| |
| Number of Immediate Jeopardy Complaints |
665 |
918 |
1,183 |
| Number of Immediate Jeopardy Complaints Not Investigated Within 2 Days* |
4 |
11 |
16 |
| |
| Number of High Priority Complaints |
5,530 |
6,206 |
6,804 |
| Number of High Priority Complaints Not Investigated Within 10 Days** |
148 |
137 |
131 |
*State did not conduct an investigation for 1 immediate jeopardy complaint between 2016 and 2018.
**State did not conduct an investigation for 20 high priority complaints between 2016 and 2018.
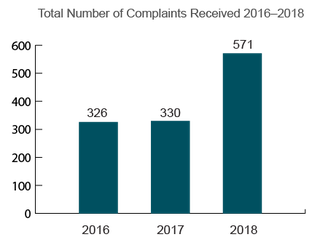
Colorado
Trends in Nursing Home Complaints
|
2016 |
2017 |
2018 |
Number of Complaints Per 1,000 Nursing Home Residents |
24.4 |
26.3 |
31.2 |
| |
| Number of Immediate Jeopardy Complaints |
27 |
28 |
40 |
| Number of Immediate Jeopardy Complaints Not Investigated Within 2 Days |
3 |
3 |
3 |
| |
| Number of High Priority Complaints |
268 |
287 |
300 |
| Number of High Priority Complaints Not Investigated Within 10 Days |
52 |
45 |
55 |
Connecticut
Trends in Nursing Home Complaints
|
2016 |
2017 |
2018 |
Number of Complaints Per 1,000 Nursing Home Residents |
18.5 |
19.4 |
23.1 |
| |
| Number of Immediate Jeopardy Complaints |
2 |
7 |
4 |
| Number of Immediate Jeopardy Complaints Not Investigated Within 2 Days |
0 |
0 |
0 |
| |
| Number of High Priority Complaints |
12 |
14 |
35 |
| Number of High Priority Complaints Not Investigated Within 10 Days |
2 |
4 |
4 |
Delaware
Trends in Nursing Home Complaints
|
2016 |
2017 |
2018 |
Number of Complaints Per 1,000 Nursing Home Residents |
16.4 |
24.8 |
44.4 |
| |
| Number of Immediate Jeopardy Complaints |
2 |
3 |
3 |
| Number of Immediate Jeopardy Complaints Not Investigated Within 2 Days |
0 |
1 |
1 |
| |
| Number of High Priority Complaints |
58 |
95 |
170 |
| Number of High Priority Complaints Not Investigated Within 10 Days** |
50 |
65 |
135 |
**State did not conduct an investigation for 18 high priority complaints between 2016 and 2018.
District of Columbia
Trends in Nursing Home Complaints
|
2016 |
2017 |
2018 |
Number of Complaints Per 1,000 Nursing Home Residents |
20 |
18.1 |
17.1 |
| |
| Number of Immediate Jeopardy Complaints |
1 |
0 |
0 |
| Number of Immediate Jeopardy Complaints Not Investigated Within 2 Days |
0 |
NA |
NA |
| |
| Number of High Priority Complaints |
13 |
5 |
0 |
| Number of High Priority Complaints Not Investigated Within 10 Days |
0 |
2 |
NA |
Florida
Trends in Nursing Home Complaints
|
2016 |
2017 |
2018 |
Number of Complaints Per 1,000 Nursing Home Residents |
33 |
30.3 |
33.8 |
| |
| Number of Immediate Jeopardy Complaints |
26 |
16 |
41 |
| Number of Immediate Jeopardy Complaints Not Investigated Within 2 Days |
3 |
0 |
2 |
| |
| Number of High Priority Complaints |
318 |
85 |
166 |
| Number of High Priority Complaints Not Investigated Within 10 Days |
4 |
3 |
10 |
Georgia
Trends in Nursing Home Complaints
|
2016 |
2017 |
2018 |
Number of Complaints Per 1,000 Nursing Home Residents |
33.6 |
26 |
36.1 |
| |
| Number of Immediate Jeopardy Complaints |
836 |
281 |
133 |
| Number of Immediate Jeopardy Complaints Not Investigated Within 2 Days |
783 |
42 |
9 |
| |
| Number of High Priority Complaints |
277 |
447 |
991 |
| Number of High Priority Complaints Not Investigated Within 10 Days |
246 |
167 |
453 |
Hawaii
Trends in Nursing Home Complaints
|
2016 |
2017 |
2018 |
Number of Complaints Per 1,000 Nursing Home Residents |
5.5 |
11.1 |
8.7 |
| |
| Number of Immediate Jeopardy Complaints |
1 |
1 |
8 |
| Number of Immediate Jeopardy Complaints Not Investigated Within 2 Days |
0 |
0 |
3 |
| |
| Number of High Priority Complaints |
2 |
2 |
4 |
| Number of High Priority Complaints Not Investigated Within 10 Days |
1 |
1 |
1 |
Idaho
Trends in Nursing Home Complaints
|
2016 |
2017 |
2018 |
Number of Complaints Per 1,000 Nursing Home Residents |
25.3 |
30.9 |
30.7 |
| |
| Number of Immediate Jeopardy Complaints |
3 |
8 |
2 |
| Number of Immediate Jeopardy Complaints Not Investigated Within 2 Days |
1 |
2 |
1 |
| |
| Number of High Priority Complaints |
16 |
25 |
87 |
| Number of High Priority Complaints Not Investigated Within 10 Days** |
13 |
16 |
71 |
**State did not conduct an investigation for 1 high priority complaint between 2016 and 2018.
Illinois
Trends in Nursing Home Complaints
|
2016 |
2017 |
2018 |
Number of Complaints Per 1,000 Nursing Home Residents |
70.7 |
73.6 |
84.8 |
| |
| Number of Immediate Jeopardy Complaints |
252 |
166 |
93 |
| Number of Immediate Jeopardy Complaints Not Investigated Within 2 Days* |
3 |
4 |
2 |
| |
| Number of High Priority Complaints |
3,567 |
4,141 |
4,522 |
| Number of High Priority Complaints Not Investigated Within 10 Days** |
36 |
676 |
1,189 |
*State did not conduct an investigation for 1 immediate jeopardy complaint between 2016 and 2018.
**State did not conduct an investigation for 2 high priority complaints between 2016 and 2018.
Indiana
Trends in Nursing Home Complaints
|
2016 |
2017 |
2018 |
Number of Complaints Per 1,000 Nursing Home Residents |
53.2 |
56.8 |
59.8 |
| |
| Number of Immediate Jeopardy Complaints |
30 |
33 |
60 |
| Number of Immediate Jeopardy Complaints Not Investigated Within 2 Days |
0 |
0 |
0 |
| |
| Number of High Priority Complaints |
733 |
923 |
991 |
| Number of High Priority Complaints Not Investigated Within 10 Days |
13 |
8 |
8 |
Iowa
Trends in Nursing Home Complaints
|
2016 |
2017 |
2018 |
Number of Complaints Per 1,000 Nursing Home Residents |
35.2 |
39.3 |
39.1 |
| |
| Number of Immediate Jeopardy Complaints |
39 |
57 |
24 |
| Number of Immediate Jeopardy Complaints Not Investigated Within 2 Days |
0 |
2 |
2 |
| |
| Number of High Priority Complaints |
556 |
633 |
596 |
| Number of High Priority Complaints Not Investigated Within 10 Days |
115 |
352 |
372 |
Kansas
Trends in Nursing Home Complaints
|
2016 |
2017 |
2018 |
Number of Complaints Per 1,000 Nursing Home Residents |
64.8 |
68.8 |
76.9 |
| |
| Number of Immediate Jeopardy Complaints |
157 |
123 |
159 |
| Number of Immediate Jeopardy Complaints Not Investigated Within 2 Days |
2 |
4 |
6 |
| |
| Number of High Priority Complaints |
209 |
400 |
437 |
| Number of High Priority Complaints Not Investigated Within 10 Days |
10 |
24 |
75 |
Kentucky
Trends in Nursing Home Complaints
|
2016 |
2017 |
2018 |
Number of Complaints Per 1,000 Nursing Home Residents |
28.2 |
30.7 |
32.1 |
| |
| Number of Immediate Jeopardy Complaints |
290 |
208 |
237 |
| Number of Immediate Jeopardy Complaints Not Investigated Within 2 Days |
11 |
6 |
6 |
| |
| Number of High Priority Complaints |
368 |
488 |
500 |
| Number of High Priority Complaints Not Investigated Within 10 Days |
18 |
9 |
68 |
Louisiana
Trends in Nursing Home Complaints
|
2016 |
2017 |
2018 |
Number of Complaints Per 1,000 Nursing Home Residents |
20.2 |
24.8 |
22 |
| |
| Number of Immediate Jeopardy Complaints |
69 |
39 |
79 |
| Number of Immediate Jeopardy Complaints Not Investigated Within 2 Days |
1 |
1 |
1 |
| |
| Number of High Priority Complaints |
267 |
348 |
262 |
| Number of High Priority Complaints Not Investigated Within 10 Days |
5 |
15 |
7 |